Content Analytics: The Formula for Creating a Successful Blog
3 Case Studies on How to Diagnose the Health of Your Blog
Note: This post was originally posted on growthmarketingconference.com.
The most common questions we're asked at Scripted.com are, "What's the ROI on a blog post?" or "How do I know if I'm doing this content marketing thing right?"
Until recently, we didn't have insight into these answers because we only delivered the writing.
But, we recently launched our Scripted Analytics product and now have the ability to dive into the most difficult questions that content marketers face.
We're excited to share them with you now!
First, let's define some important key concepts.
A Few Definitions:
- Evergreen content. We define an evergreen post as one that continues to drive readers to your blog one year after it was published. Evergreen posts have, via good writing, interesting and lasting topics - or good distribution - remained popular and accessible by readers. A post about the history of a product category would be more likely to have lasting engagement, and therefore remain evergreen, than a post about a specific product release. Evergreen posts are the gift that keeps on giving, driving readers to your blog long after publishing.
- Viral content. When one of your recent posts clearly dominates your recent traffic, we define that as viral. Not everything you push out will get on the front page of Reddit and Buzzfeed, but if it performs far better than your other recent posts, we view that as viral relative to your baseline. Viral content can signal hot topics for your readers while also providing clues as to which distribution channels work best for your content.
- Users, Visits, and Time on Page. Each of these statistics is trackable and each surfaces a different facet of your customer engagement. Users shows how many unique individuals came to read a post on your blog. Visits tells you how many times they returned. Time on Page informs you of their overall interest. The longer you keep your customers engaged, the more likely they are to convert.
How to interpret Scripted Analytics charts
In order for you to more easily understand the following case studies, I'm going to quickly break down how our Scripted Analytics graphs work:
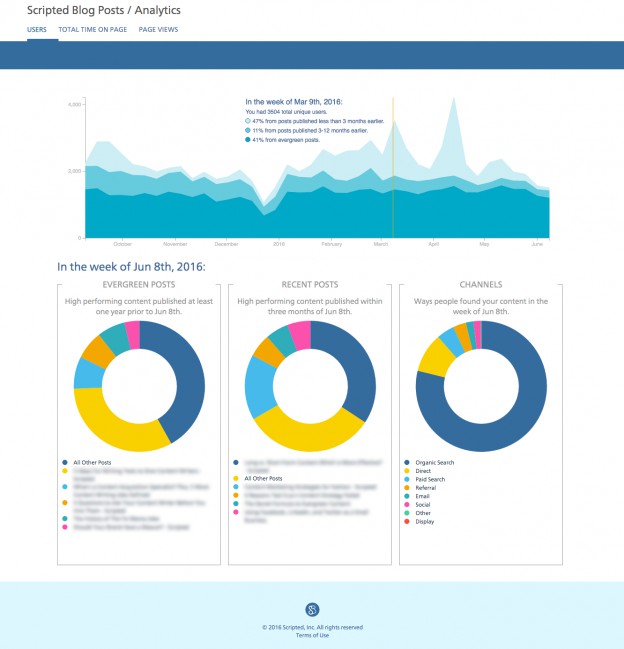
Streamgraph
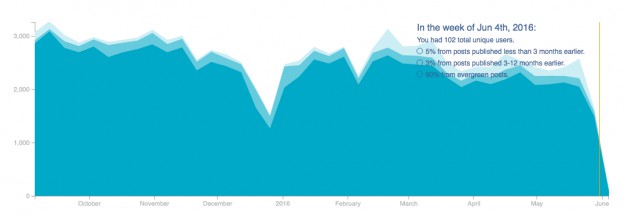
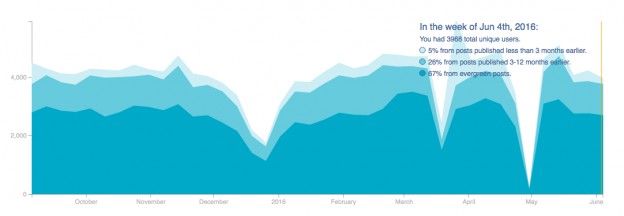
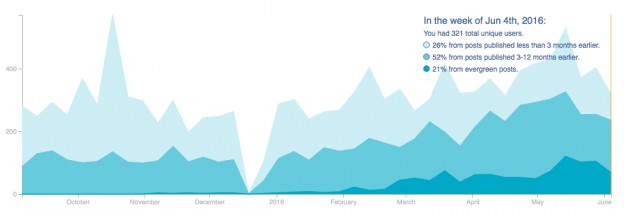
The dark blue section represents the volume of traffic coming in from evergreen content (published more than one year ago), the lighter blue section is transitioning content (published between 3 and 12 months ago,) and the faint blue on top is recent content published in the past 3 months.
These time frames are all relative to the week you select, by mousing over and clicking. The sum of these distinct cohort streams, as shown by their stacking up, represents your total blog traffic.
Donut Charts
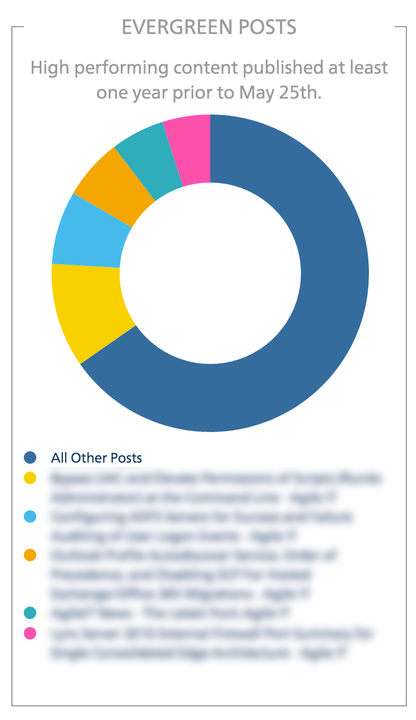
A successful evergreen donut has most of its mass in the "All Other Posts" category.
This means that there is no one single post responsible for evergreen traffic, which makes your readership less vulnerable to shifts in distribution channels (a linking partner changing a post, a social media drive ending, a front page mention timing out) or topic fatigue.
A diverse post portfolio in your evergreen chart ensures a lasting and stable traffic base for your blog.
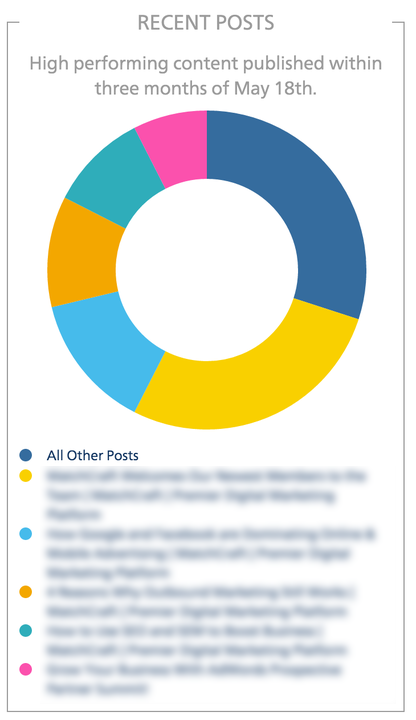
The counterpart to the evergreen donut, the recent donut, seeks to inform you about which of your recent posts are performing best.
Posts are like diverse experiments in reader interest, and this chart quickly highlights which experiments are going well. The ideal recent donut has most of its traffic driven by a few superstars, which, with the right focus on distribution, will ideally trickle down the streamgraph over time to become part of your evergreen bedrock.
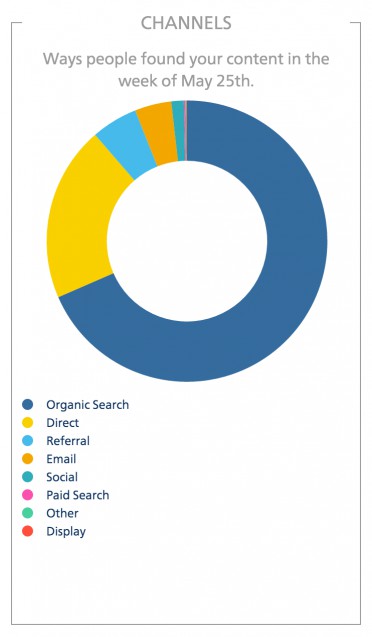
If the evergreen and recent donuts inform you on the 'what' of your successful content, the sources donut clues you into the 'how'.
Marketing campaigns via social or email marketing, paid ads, or good ol' organic search can quickly be surfaced here.
Armed with the knowledge of which posts are most engaging to users from the evergreen and recent donuts, the sources donut can direct efforts to reach customers in the ways that have been most successful to you in the past - and track the progress of new ventures.
Now, on to the good stuff...
Three blog analytics case studies
Let's look at three examples of real company blog analytics and discuss what we can learn from them.
Case Study 1: Evergreen Decay
Evergreen Decay is a blog that initially looks spectacular, with high weekly traffic flow and an abundance of evergreen content. However, on close examination of the cohort streams, we can identify a stale content strategy as the primary cause of an overall slow decay.
What we can learn
Even the most engaging content will get less readership over time due to topic saturation and changing reader interests.
[Tweet "Even the most engaging content will get less readership over time. #Blogging #ContentMarketing"]
In this case, too much of this blog's traffic is coming from evergreen content. Some weeks, evergreen content accounts for 90% of traffic.
While that speaks to the quality of the writing and distribution of old posts, without new content to interest readers, the overall engagement of the blog is steadily dropping. Fresh content is almost non-existent in some weeks, meaning the company is not continuing to publish new content or distribute its new content successfully.
This is slowing performance partially masked by the strength of their evergreen cohort, but without replenishment, reader interest is slowly grinding down.
How they can improve
This company needs to post new content regularly again.
They should look at both recent and evergreen posts in their donut charts that have been successful and expand upon those topics, while also promoting these posts via the distribution channels from the sources chart that have traditionally worked well.
[Tweet "In order to maintain #BlogGrowth, evergreen content needs to be supplemented with fresh content."]
Case Study 2: A Healthy Baby (With Hiccups)
In contrast to the Evergreen Decay blog, this Healthy Baby shows a lot of promise.
What we can learn
This blog has the breakdown of recent to evergreen traffic that we've seen as indicative of the best-performing blogs: about 2/3 evergreen and 1/3 new posts.
[Tweet "The best performing #blogs contain 2/3 evergreen and 1/3 new content posts."]
This way, the new posts will convert to transitioning, and eventually to evergreen, diversifying this blog's content age and engagement. We found that despite two hiccups in their traffic - which were unfortunate instances of blog downtime in March and April - their readership steadily increased.
How they can improve
These guys simply need to maintain! Their topics and choices of distribution channels are building up readership quickly and keeping it engaged with a diverse content offering. They should strive for better uptime so readers don't shy away from their blog. Other than that, it appears to keep moving up and to the right.
Case Study 3: Growing Pains
In our final example, we see the Growing Pains blog, a new blog that is having trouble getting off the ground and really engaging with readers.
What we can learn
At a glance, overall traffic trends positively, but a closer look reveals some trouble areas.
An overwhelming part of the traffic is driven by fresh content, but despite high levels of conversion to the transition stream, very little of that early, successful content is converting into evergreen. This means that a large portion of traffic is dependent on recent blog posts as opposed to a more diverse offering, making day to day traffic shaky and unpredictable.
Compounding this problem, topics selected for these blog posts aren't carrying weight with readers or being distributed in successful channels, resulting in a fast decay with no evergreen conversion.
How they can improve
This team needs to identify topics with evergreen potential by analyzing the few posts that have withstood the test of time.
[Tweet "Identify topics with evergreen potential by analyzing current top performers. #Blogging"]
They might also consider using popular trending topics to make their posts more widely accessible. We also recommend that they diversify their distribution channels and track which ones really work over the coming weeks, then double down on those channels.
The key here is to make sure that the posts they publish recently are getting traffic long after publication.
Conclusion
There's no formula for how to create a successful blog. That takes good writing and consistent publication. We have found that there is a formula, however, for diagnosing the overall health of your blog. The formula is:
- About two-thirds of your blog's traffic should come from evergreen posts.
- Your evergreen traffic should come from a variety of posts, distributed evenly, rather than just a few high performers.
- About one-third of your blog's traffic should come from recent posts.
- Your recent post traffic should be spikey, with a few posts going (relatively) viral among your readers and their followers.
- If you can maintain this traffic profile while publishing consistently, you will see your overall blog traffic growth snowball upward as recent posts transition into evergreen posts.
Why does this matter?
It matters because the more minutes that visitors spend on your site, the more likely they are to convert. This conversion could be as simple as signing up for a newsletter or demo, or going all the way through an e-commerce shopping cart purchase. This is a numbers game, and the more activity at the top of the funnel will drive conversions through the bottom of the funnel.
Whether you use our Scripted Analytics tool or any number of other blogging analytics products, the important takeaway is that it's critical to discover trends in your content's performance.
[Tweet "To maintain a healthy #blog, it's critical to discover trends in your content's performance."]
If you see that recent content is not performing well, you have to address it quickly or risk compromising future growth from evergreen content. There's a discipline involved here in maintaining both a macro and a micro view of your blog, but the benefits will pay off. I promise!
This post was written by Ryan Buckley, Co-founder Scripted.com, and Boris Vassilev, Data Scientist at Scripted.com
Published by Ryan Buckley on Thursday, August 4, 2016 in Content Marketing, Analytics, Blog Measuring, Roi.
